Statistical Information
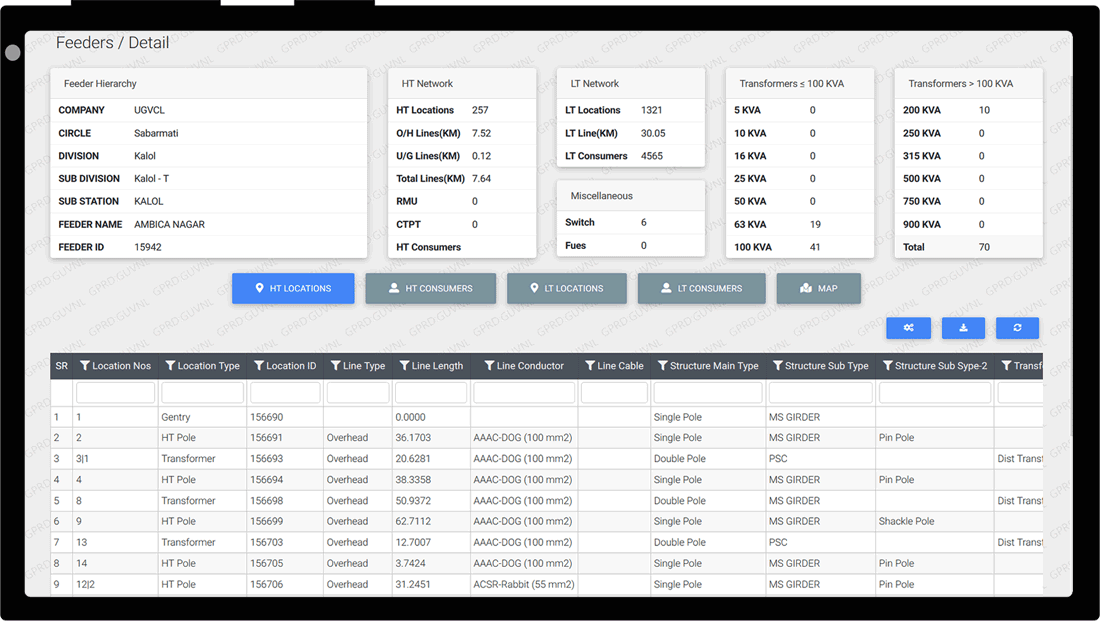
The above screen is an example that how your feeder statistical information will be displayed at user level, object level filters are available by which user can easily get all the statistical information related to that object.

Feeder Data
It shows you all the data related to your surveyed feeder including total locations, lines in km, total transformers, consumer information etc.

Vector Based Map
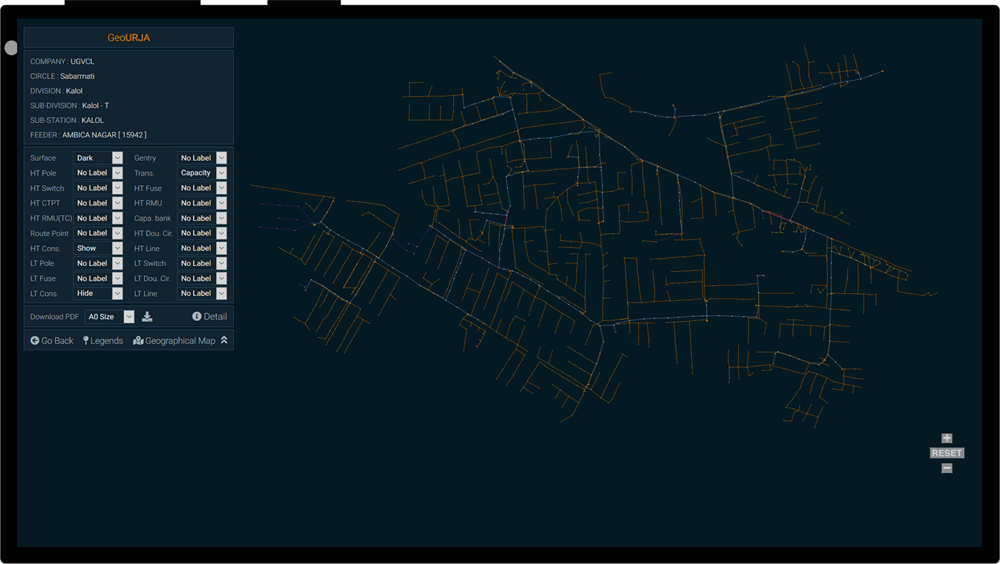
A rich vector based map is the solution for your feeder analysis, as well as server filters are available to show-hide components on the map which makes feeder analysis better and sufficient, also allows you to download/export the map in portable document.

Geographical Map
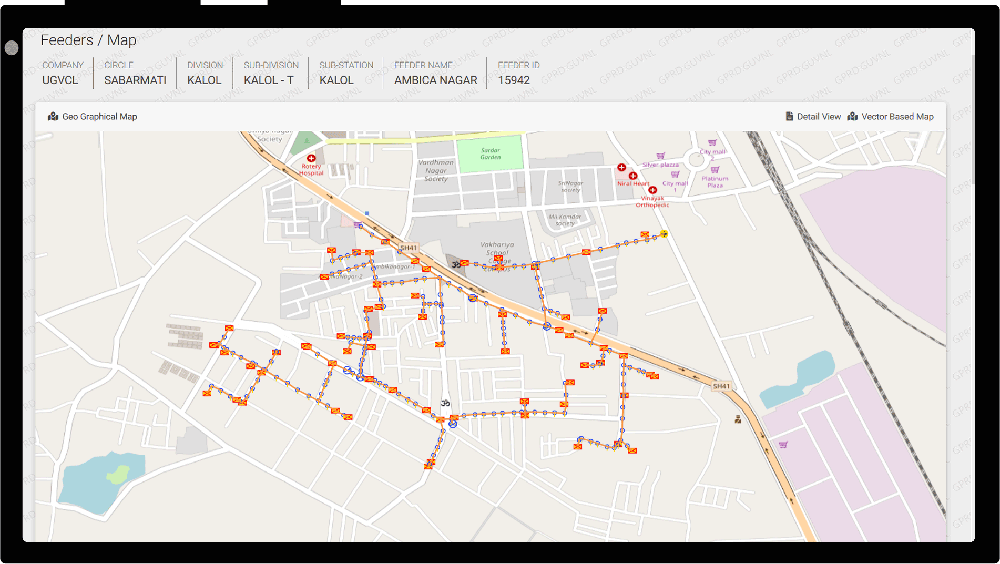
A elegant view for your surveyed feeder – Geographical Map, By which user can see a feeder on geographical map makes it easy to understand the entire feeder flow as well as can get idea of feeder-road crossing, river crossing etc.

Feeder Map Export Facility
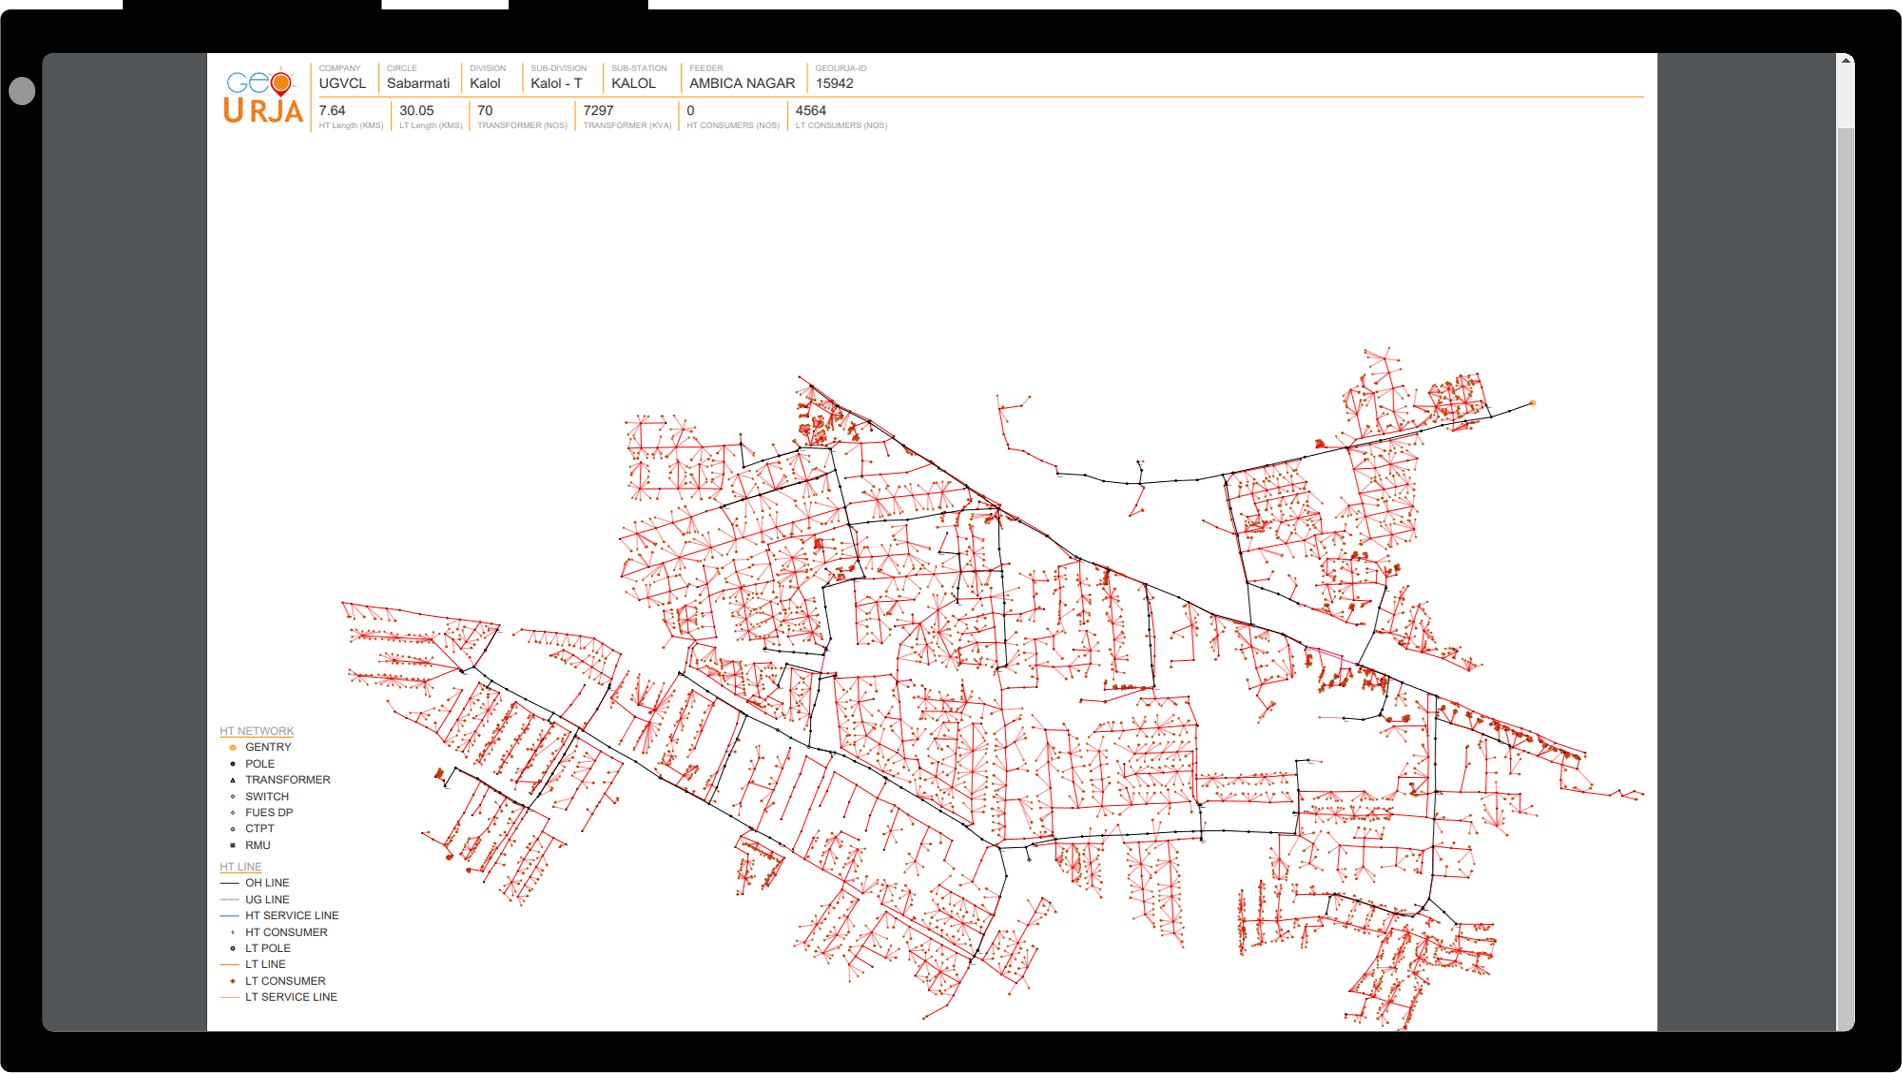
Not only digitally but you can also see a map of your surveyed feeder on paper. vector based map on dashboard allows you to download/export a feeder map with several standard sizes, so you can print it for office paper work purpose.
VERY GOOD APPLICATIONM
Thank you.
Sir,
Pl. Clear all data & map of following feeder for resurvey for correction.
Hidden information
Please create a ticker for it inside helpdesk of dashboard.
Tankara sub division